
USES data - Normal Swallow
Set 1 – Swallow data with tracking and hyoid plots
This video shows an example of a participant drinking a cup of 100ml water continuously, with the ultrasound image displayed on the left and the image from the camera on the right. In the ultrasound video, you can observe the participant taking five sips to finish the cup of water, with the tongue propulsion and hyoid elevation clearly visible.
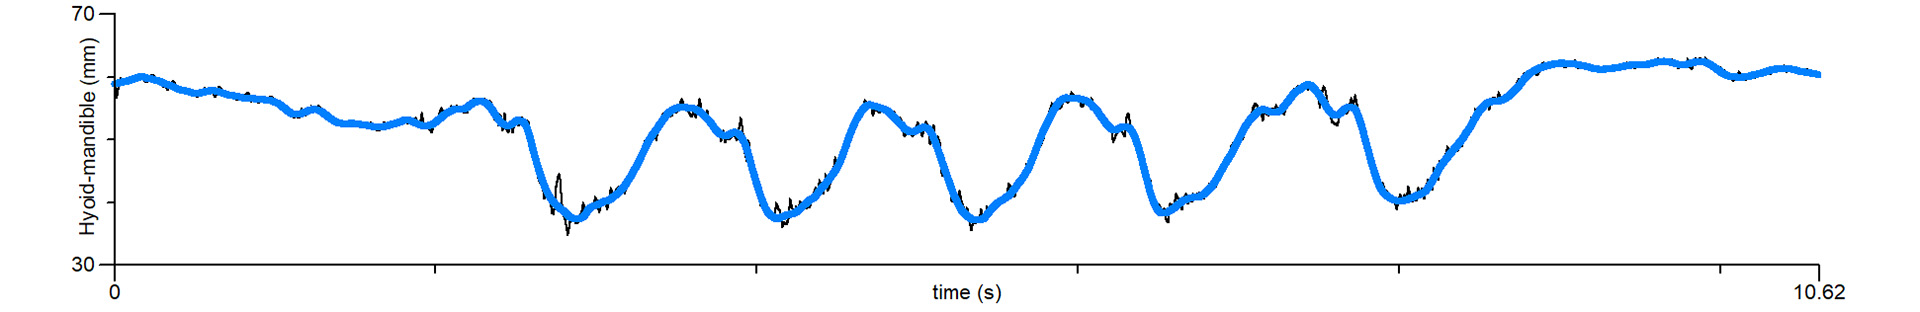
Tracking information was superimposed on the ultrasound image, with the blue line marking the hyoid-mandible distance and the red line on the surface of the tongue. With the tracking information, the degree of hyoid excursion could be quantified.
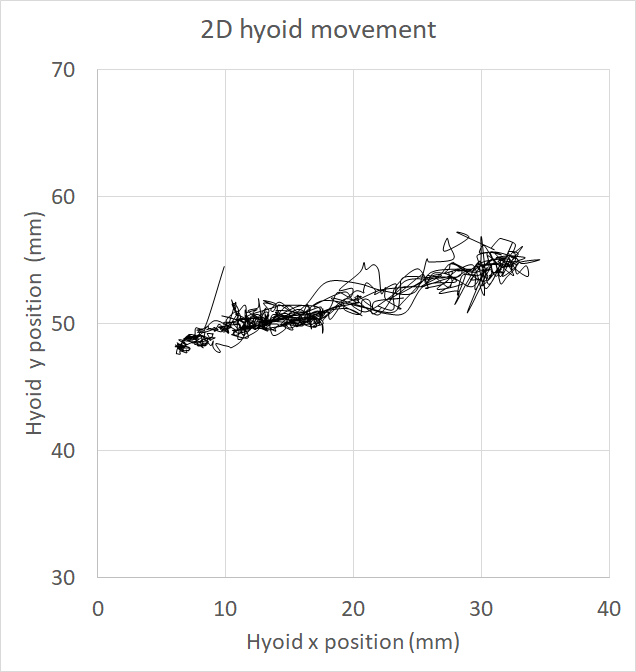
The 2-dimensional movement of the hyoid in the midsagittal plane is shown above. It was interesting to note that for sequential swallows as in this example, only forward and backward movements were observed. No upward and downward movement commonly reported in single swallow was observed.
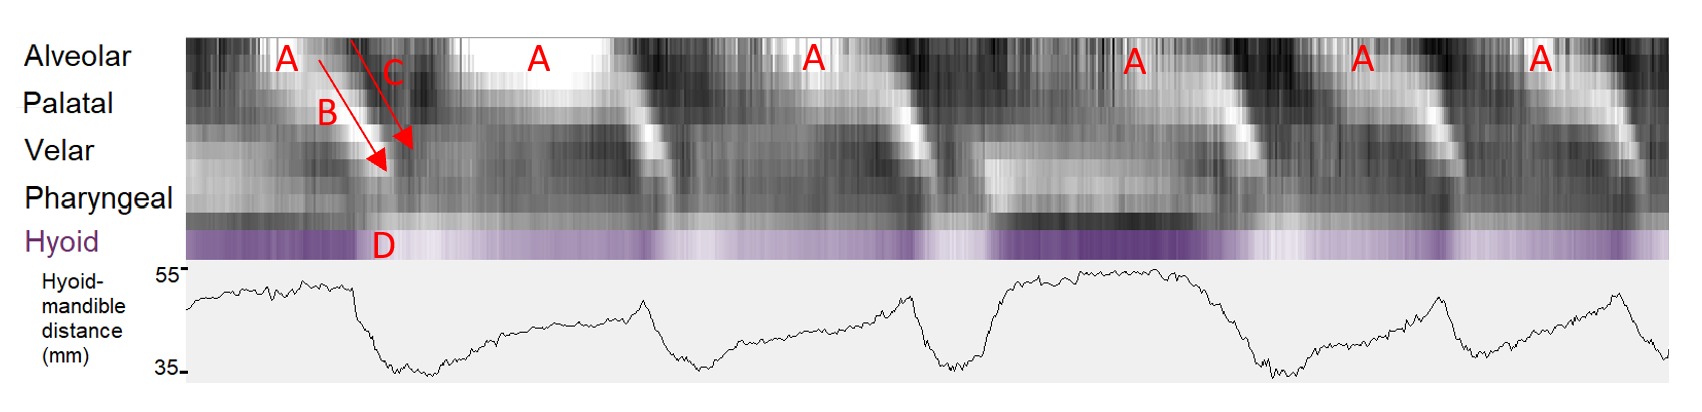
The grayscale glossogram here showing sequence of swallows of 100ml water from a cup, with the following timepoints are labelled:
A - Tongue tip lowers to accept bolus
B - Tongue sectors contract in sequence to carry the bolus posteriorly.
C - Sectors of the tongue extend to squeeze the bolus posteriorly.
D – Hyoid advances as bolus reaches the pharyngeal stage. Below is a plot of hyoid-mandible distance in mm.
Set 2 – Single swallows
This set of data consists of four 10ml water swallows, which are typical swallows that would be used in swallowing assessment.
The first two videos show a typical view of the ultrasound image of a single swallow, where you can see the bolus entering the mouth, posterior propulsion of the bolus by the tongue, and hyoid elevation during the pharyngeal swallow.
In these two videos, the automatic tracking of the hyoid-mandible distance and the tongue are superimposed on the single swallows. The same swallow sequence could be observed, but the addition of the tracking made the observation easier.
Set 3 – Continuous cup drinking
This set of data consists of four 100ml water drinking swallows. This is typically used in swallow screening and is more reflective of day-to-day swallows. Participants were given one cup of 100ml water and told to drink it continuously as per usual.
In these videos, you can observe the individual differences in how they perform continuous cup drinking. The first video shows that the hyoid returns partially to the resting position between swallows. However, in the second video, the individual held the hyoid bone in a higher position for three consecutive swallows before lowering it closer to the resting position, and this sequence was repeated several times to complete the task of 100ml cup drinking.
In these two videos, the automatic tracking of the hyoid-mandible distance and the tongue are superimposed on continuous cup drinking, which improves the visibility of the tongue and the hyoid throughout the recording.